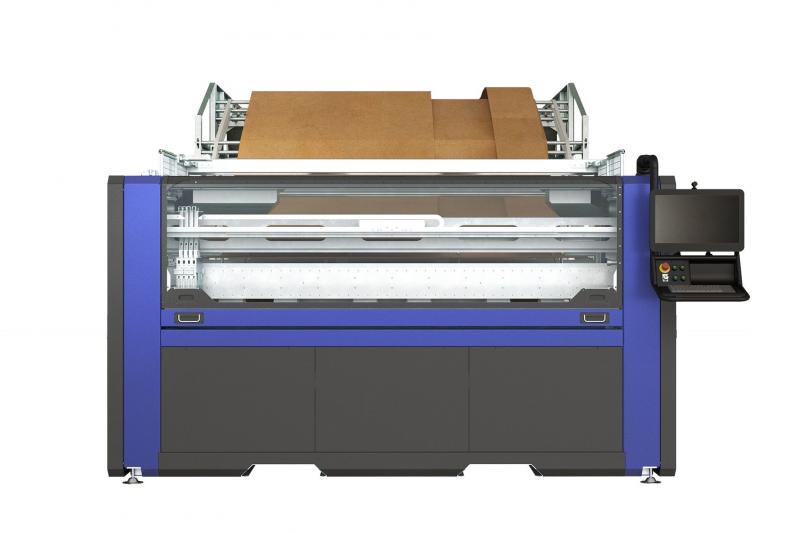
Example configuration
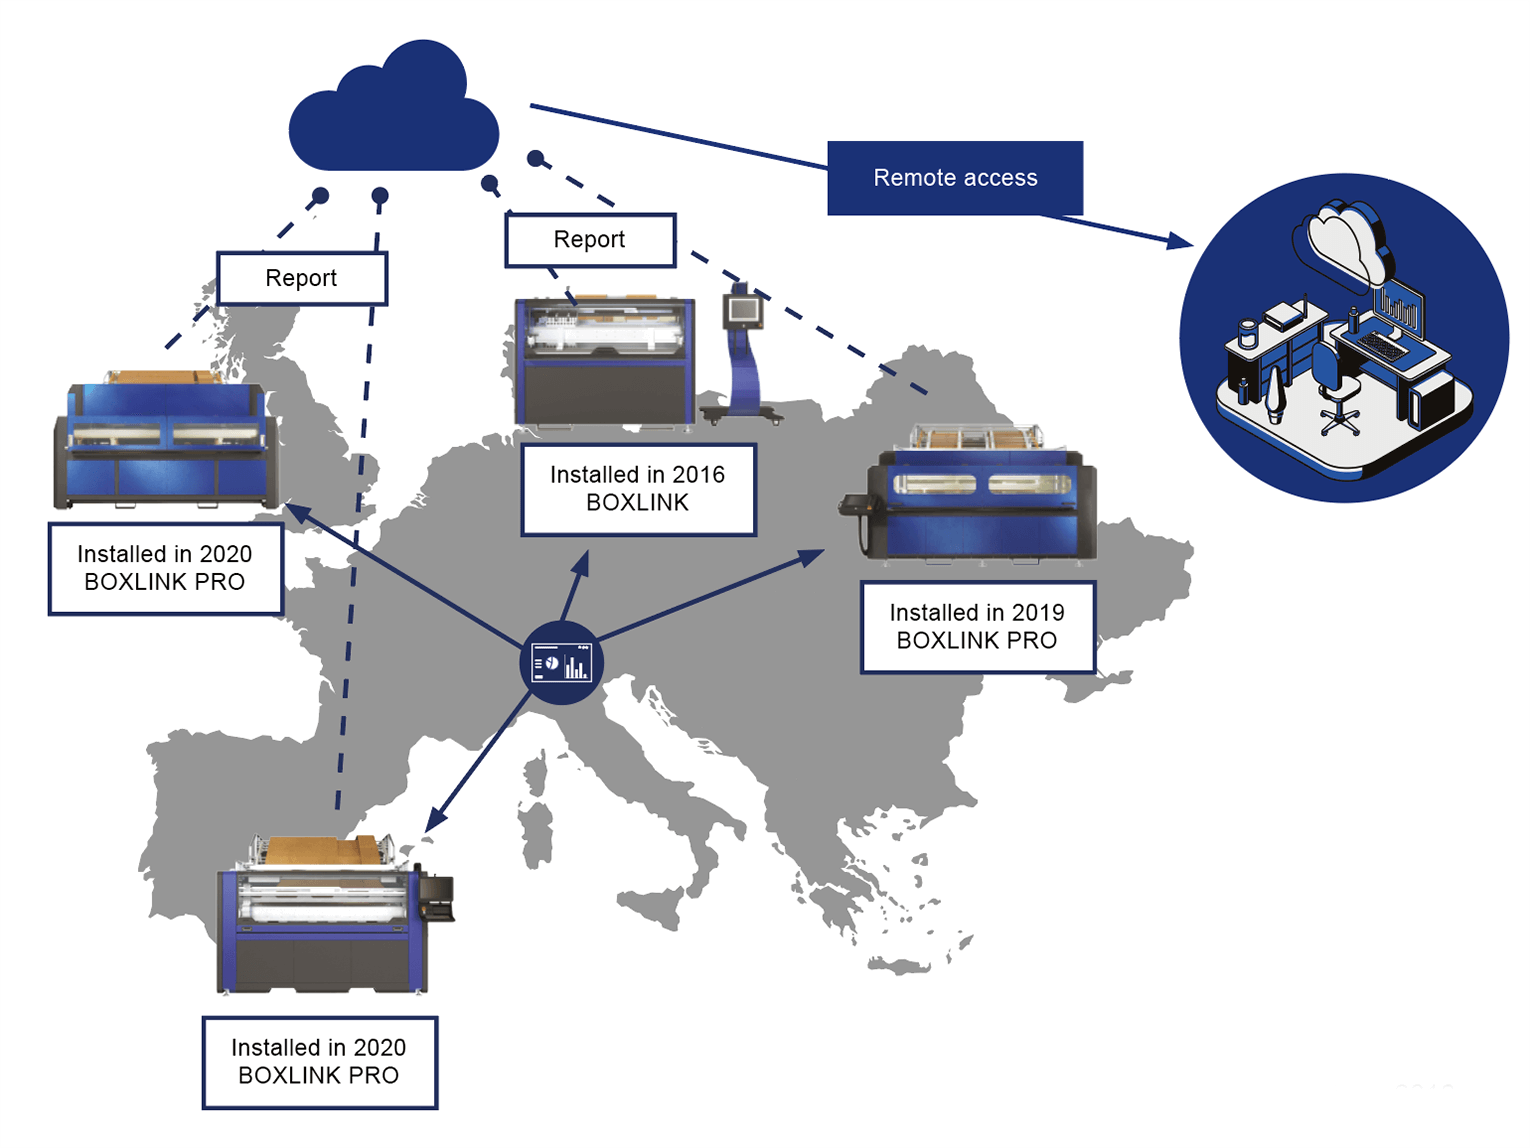 Configuration and report visualization of machines installed from 2016 on
Configuration and report visualization of machines installed from 2016 on
Configuration and report visualization of machines installed from 2016 on
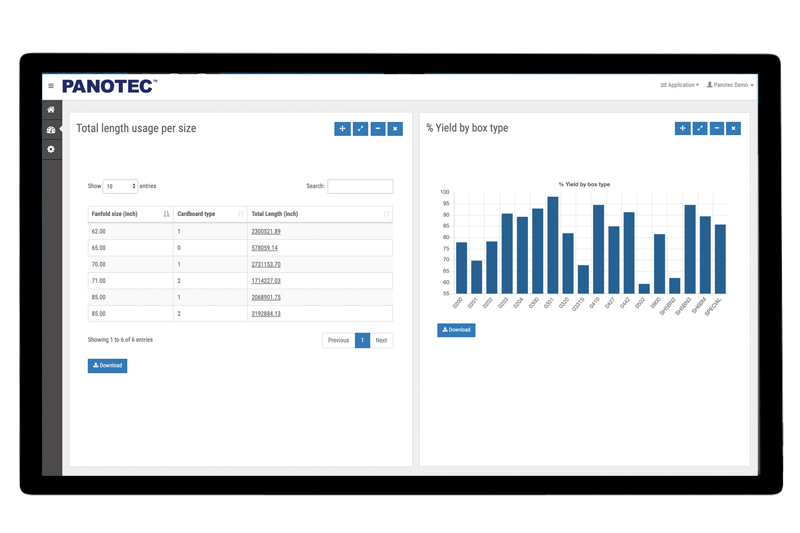
One of the most important features is the option of monitoring the use of cardboard in terms of its length (Total length usage per size), in order to optimize resources.
This is connected to the module % yield by box type, which shows the output in percent for each type of box used (and therefore the difference in waste), with reference to the selected time frame.
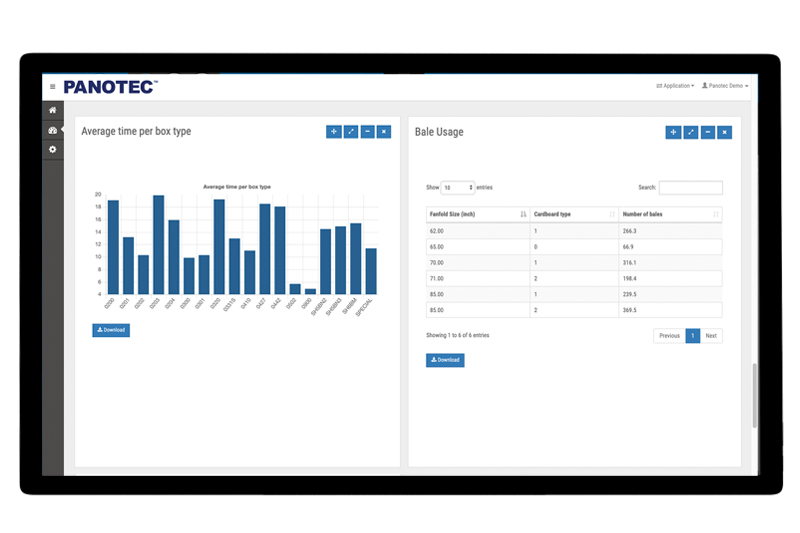
A further control tool is the fanfold usage which shows the overall linear meters of cardboard used for each box type.
The chart relating to the average time per box type states the average lead time of the machine needed to produce the boxes divided by type.
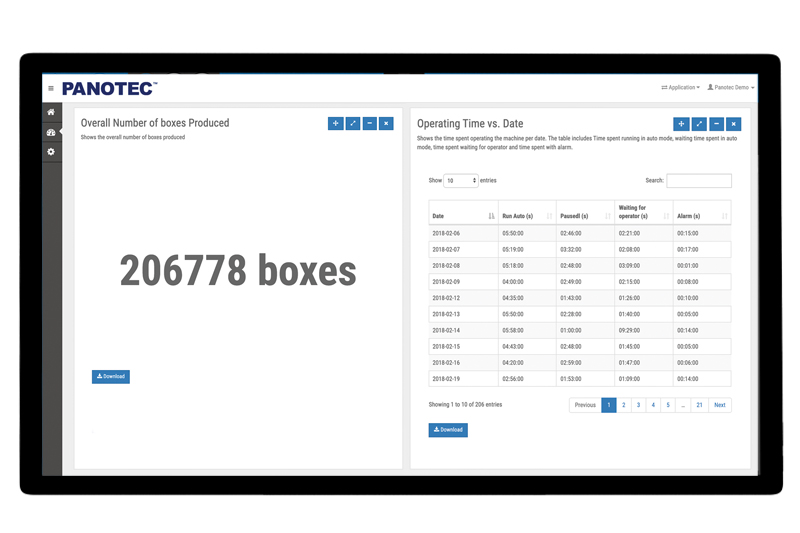
The production of boxes can be assessed on the chart boxed produced vs. date, which shows the total numbers day by day, within the selected period of time.
To check the total amount of effective operating hours of the machine, down times in hours or the amount of hours during which production has been interrupted due to lack of orders, go to section operating times vs. day.